Last week a new ice2ice article was published-below the ice2ice authors have written a short version covering the main findings. The full paper can be found here: Geng, Marilena Sophie, Jens Hesselbjerg Hesselbjerg Christensen, and Torben Christensen. “Potential future methane emission hot spots in Greenland.” Environmental Research Letters (2018).
by Marilena Sophie Geng, Jens Christensen Hesselbjerg, and Torben Røjle Christensen
Permafrost is defined as ground at a soil temperature below freezing for at least two consecutive years. It is an important part of the cryosphere as 25 % of the northern hemisphere is underlain by permafrost and it stores a large amount of carbon in the frozen ground.
In a changing climate and warming Arctic, permafrost is starting to thaw more and more. The frozen organic matter in the ground can therefore reach temperatures above freezing and become available to decay. Decomposition of organic matter produces greenhouse gases. A feedback loop is triggered, higher temperatures lead to thawing permafrost lead to greenhouse gas emission lead to higher temperatures. Depending on the oxygen available to decay either carbon dioxide (CO2) or methane (CH4, which we concentrated our work on) is released.
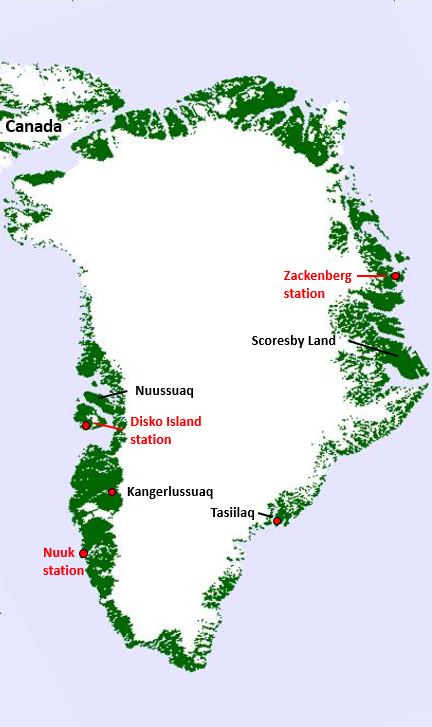
Permafrost can be found in all cold regions like Alaska, northern Canada, Siberia and Greenland. As we had high spatial resolution model simulations of Greenland (figure 1) for present and future scenarios at hand, we used those for a permafrost analysis.
The issue with permafrost analysis is that most climate models don’t have permafrost and methane emissions included in their formulation. A high resolution of the soil and complicated processes within it (that are partially still not fully understood) would be needed which is often computationally to expensive at the moment. So our idea was to find a way to derive permafrost conditions and methane emissions from parameters that are in all climate models.
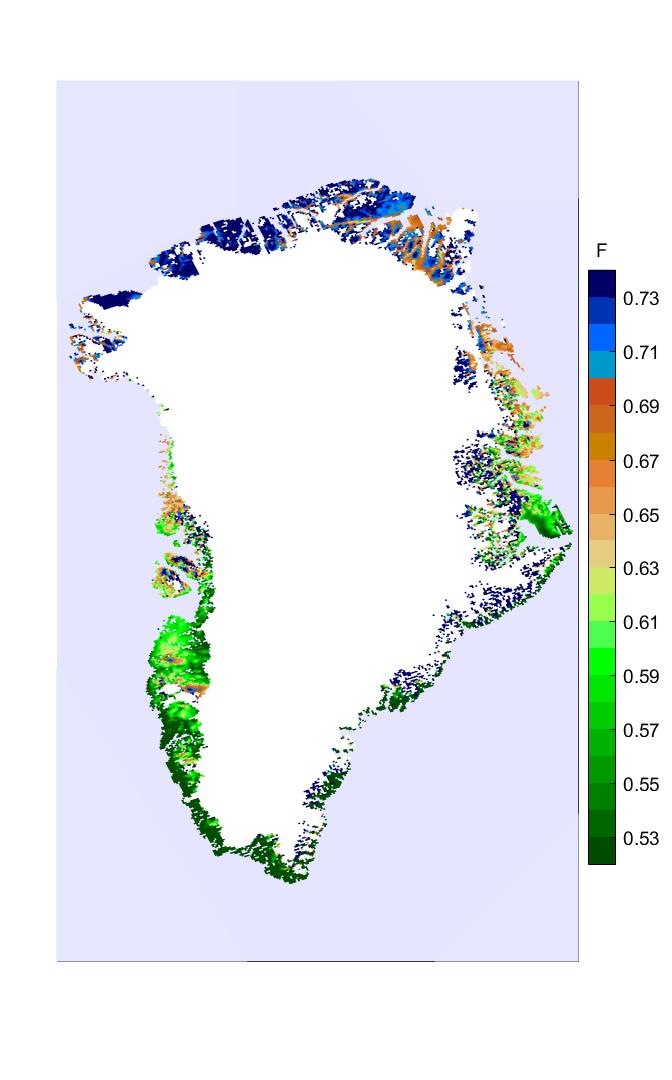
In a first step we use an established frost index that uses a ratio of degree days of freezing and thawing to derive permafrost conditions from our HIRHAM5 regional climate simulations. We can compare the permafrost conditions predicted by the frost index with observations from Greenland. As we are satisfied with the performance of the frost index and the model, we use the index for simulations of future climate scenarios and find spots on Greenland that showed significant thawing of permafrost (figure 2).
In a second step, we need to find a correlation between methane emissions from permafrost and some other variable included in the climate model. We can use methane flux data from the GEM (Greenland ecosystem monitoring) project in Nuuk and Zackenberg. We test correlations of methane emissions with air temperature, sensible and latent heat flux. Finally, we find that an exponential relationship between methane emissions and air temperature describe the observations best. As the air temperature rises, methane CH4 emissions increase exponentially.
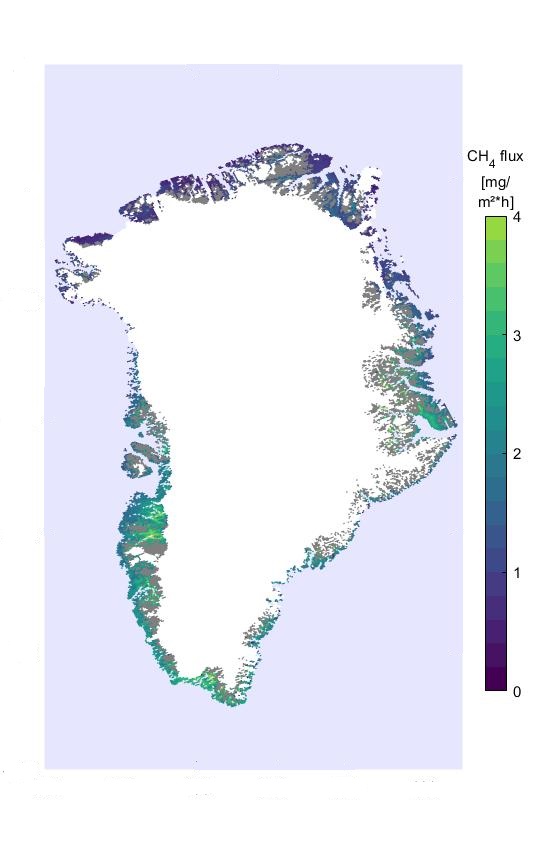
We can use the found correlation all over Greenland with our present day and future simulated temperatures. When we now compare our maps of future potential methane emissions and permafrost thaw we find spots that show both, potential high emissions and thawing permafrost (figure 2 and 3). These spots, like Kangerlussuaq and Scoresby land, are likely to show high emission in the future and need some additional monitoring.