by ice2ice PhD Andreas Plach
Many people are interested in how much the melting of the Greenland ice sheet will contribute to rising sea levels in the future. In my PhD I therefore investigate how the Greenland ice sheet looked like during the last period with much warmer summers on Greenland than today, a period called the Eemian interglacial period approximately 125,000 years ago. Ice from this period has been found in several Greenland ice cores and we therefore know that Eemian ice is preserved at the bottom of the Greenland ice sheet. Unfortunately, it is impossible to get an exact picture of the Eemian ice sheet from these few ice core data points and we therefore need to use computer models to simulate the Eemian ice sheet and get a more complete picture of its extent and the sea level rise it caused. If we know how much smaller the Eemian Greenland ice sheet was, this will help us to know how the Greenland ice sheet behaves in a warmer climate and to estimate how much smaller it will become in the warming future.
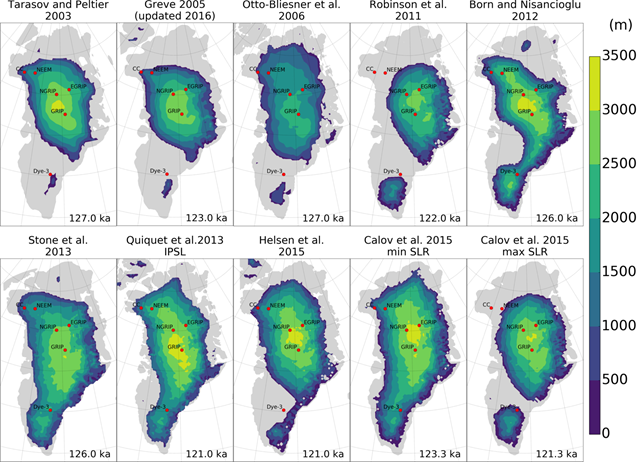
However, it is challenging to simulate the Eemian Greenland ice sheet. Many previous studies which did simulate the Eemian ice sheet, got very different results (Fig. 1). In our recent paper, we try to understand what caused the large differences in between these previous studies and we focus on how different surface mass balance (SMB) models (which are used to simulate the melting of the ice sheet) behave in the warm Eemian climate. A comparison of various SMB (melt) models shows large differences in melt between these models. Since the previous studies (Fig. 1) partly used different SMB models, the variation in simulated melt in these SMB models is likely a cause for the differences between the previous studies. Our results show the high importance of SMB model selection for Eemian ice sheet simulations which will help scientists to improve future attempts to simulate the Eemian Greenland ice sheet.
Want to know more?
Read the full paper where we compare different surface mass balance (SMB) models for the Eemian interglacial period: https://www.clim-past.net/14/1463/2018/cp-14-1463-2018.pdf
You might also be interested in our recent discussion paper where we simulate the Eemian Greenland ice sheet with a selection of SMBs derived in the paper above: https://www.the-cryosphere-discuss.net/tc-2018-225/tc-2018-225.pdf