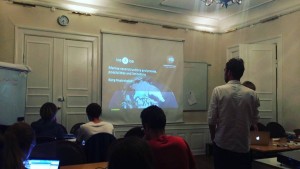
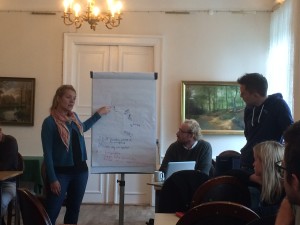
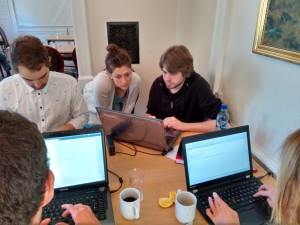
A bootcamp for the ice2ice PhDs took place in Nothern Sealland, Denmark. 17 phd’s and 5 mentors participated in the workshop that lasted 5 days. Below a report from the Phd’s.
Day 1. Monday, September 28th
From Copenhagen, we drove 1.5 hrs to Anneberg hostel on Nord-Sjælland, where we would spend the whole week. Following a group lunch, we made a quick introduction round and started right away with short presentations of the three workshop groups:
- Ocean temperature during Dansgaard–Oeschger (DO) events – DO dynamics debated; simulation of full DO cycle challenging – proxy surrogate method – model data pool vs. proxy data pool (resolution 1-2 degrees) – model run that fits proxy data – spatial consistency?
- Sea Ice and Greenland accumulation – How is sea ice influencing accumulation on Greenland? Spatial correlation between sea ice and accumulation; investigate influence of delay; investigate possible mechanisms for accumulation-sea ice connection
- Inverse modeling of ice shelves – explicit focus on method (inversion – i.e. invert surface velocity fields for viscosity or basal friction to best fit observed velocities) – inverse theory + real world experiments in Antarctica (no present-day ice shelves in Greenland)
The introduction of the workshop groups was followed by our first science talk by Camille Li. Camille gave a quick introduction to the climate system and how to come from the real world to a climate model.
Day 2. Tuesday, September 29th
The morning started with a science talk by Chris Borstad, who talked about changes in ice shelf rheology.
Afterwards, the group work started with a meeting with the mentors, and the session lasted until dinner. The evening consisted of a data visualization workshop. Here Aleksi showed different approaches to plot flow patterns when making geographic maps. Camille Li showed plots from her contribution to the IPCC (2014) report about temperature and precipitation response to freshwater hosing (8.2 ka event). Henning talked about color graphics in plotting, and introduced a MATLAB function that always created the most distinguishable colors when plotting. Chris talked about how the choice of colormap should depend on the data, and why the color scale can perceive the reader.
Day 3. Wednesday, September 30th
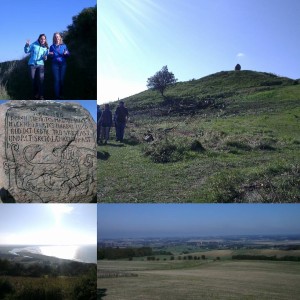
After group work sessions in the morning we went on a field trip to the Geopark Odsherred in the afternoon to learn about the regional cultural and geological background of eastern Denmark. The field trip included visits of two barrows from the Stone Age and Bronze Age as well as an easy hike on one of the highest ’mountains’ in Denmark, the 121 m high mound Vejrhøj. The hilly landscape was largely shaped during the last glacial when advancing and retreating glaciers led to the formation of moraines, meltwater outlets and proglacial lakes.
In the evening Bjørg Risebrobakken gave a science talk about proxies in paleoceanography and their possibilities and limitations.
Day 4. Thursday, October 1st
This day was filled with intense group work, preceded by Andreas Born’s talk on the Influence of ice sheet topography and sea ice cover on Eemian Greenland temperature and precipitation.
- Background info on Eemian
- Simulations of atmospheric effects on Greenland during Eemian
- Precipitation changes (using site of today’s NEEM during Eemian)
Day 5. Friday, October 2nd
The final day involved some intense finalization of the three group projects. Findings were presented after lunch. They main findings were
1) Ocean temperature during Dansgaard–Oeschger (DO) events – The proxy surrogate method has great potential for combining proxy records with model simulations. According to the model runs, the temporal variability of the Nordic Seas and northern North Atlantic can be explained well by the proxy sites available. However, information from eastern Greenland/close to Fram Strait is lacking, and proxy reconstructions from this area would be highly valuable. Spatial maps of sub-surface temperatures from DO event 7, and a constructed idealized DO event, were made. The results were quite sensitive to small changes in the reconstructed sub-surface temperature values. This needs to be investigated further. The results were limited by the little variability in the model run compared to observations.
2) Sea Ice and Greenland accumulation – The correlations patterns between sea ice and accumulation and δ18O data for NEGIS/EGRIP showed that it was difficult to determine the cause of correlations (co-causality problem). The correlation results were not consistent with the NAO pattern driving changes in sea ice and δ18O. However, lower elevation and near-coastal ice cores (Camp Century, Renland, ATC10) were more sensitive to local sea ice conditions.
3) Inverse modeling of ice shelves – Inversion results (for Pine Island Glacier, W. Antarctica) are sensitive to initial guess of the parameter we want to invert for (ice shelf: rheology; grounded ice: basal friction). Form of cost function (absolute/logarithmic/average misfit) renders slightly different results. Also wanted to test how incomplete spatial data coverage affect inversions, but some model technicalities prevented final conclusions here.
The final presentations marked the formal end of the bootcamp. Participants were afterwards witnessing how to skin a deer (hunting season just started the same day) and joined for mushroom picking in the forest nearby. The deer and mushrooms ended up on the grill and in a sauce, and finally on participants’ plates.
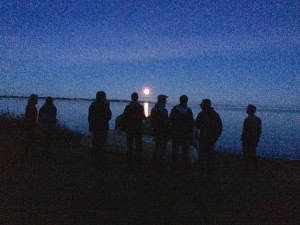
Most people thought that the bootcamp was very relevant to their own PhD research, and that they would like to see another such event in the future, in the same or slightly different format.
author: Henning Åkeson on behalf of the ice2ice PhD’s
