“But is that significant?” You have probably heard that question many times. Perhaps you can confidently say “Yes it is”. Perhaps you don’t know. Perhaps you are not enitrely sure how to test if it is significant or not. Perhaps you just used a build-in tool in your favourite program, got a p-value that looks reasonably and say “sure, that looks significant enough”. Regardless of you being a statistical master or apprentice, you just missed out on a great opportunity to learn even more statistics.
by ice2ice PhD Ida Ringaard
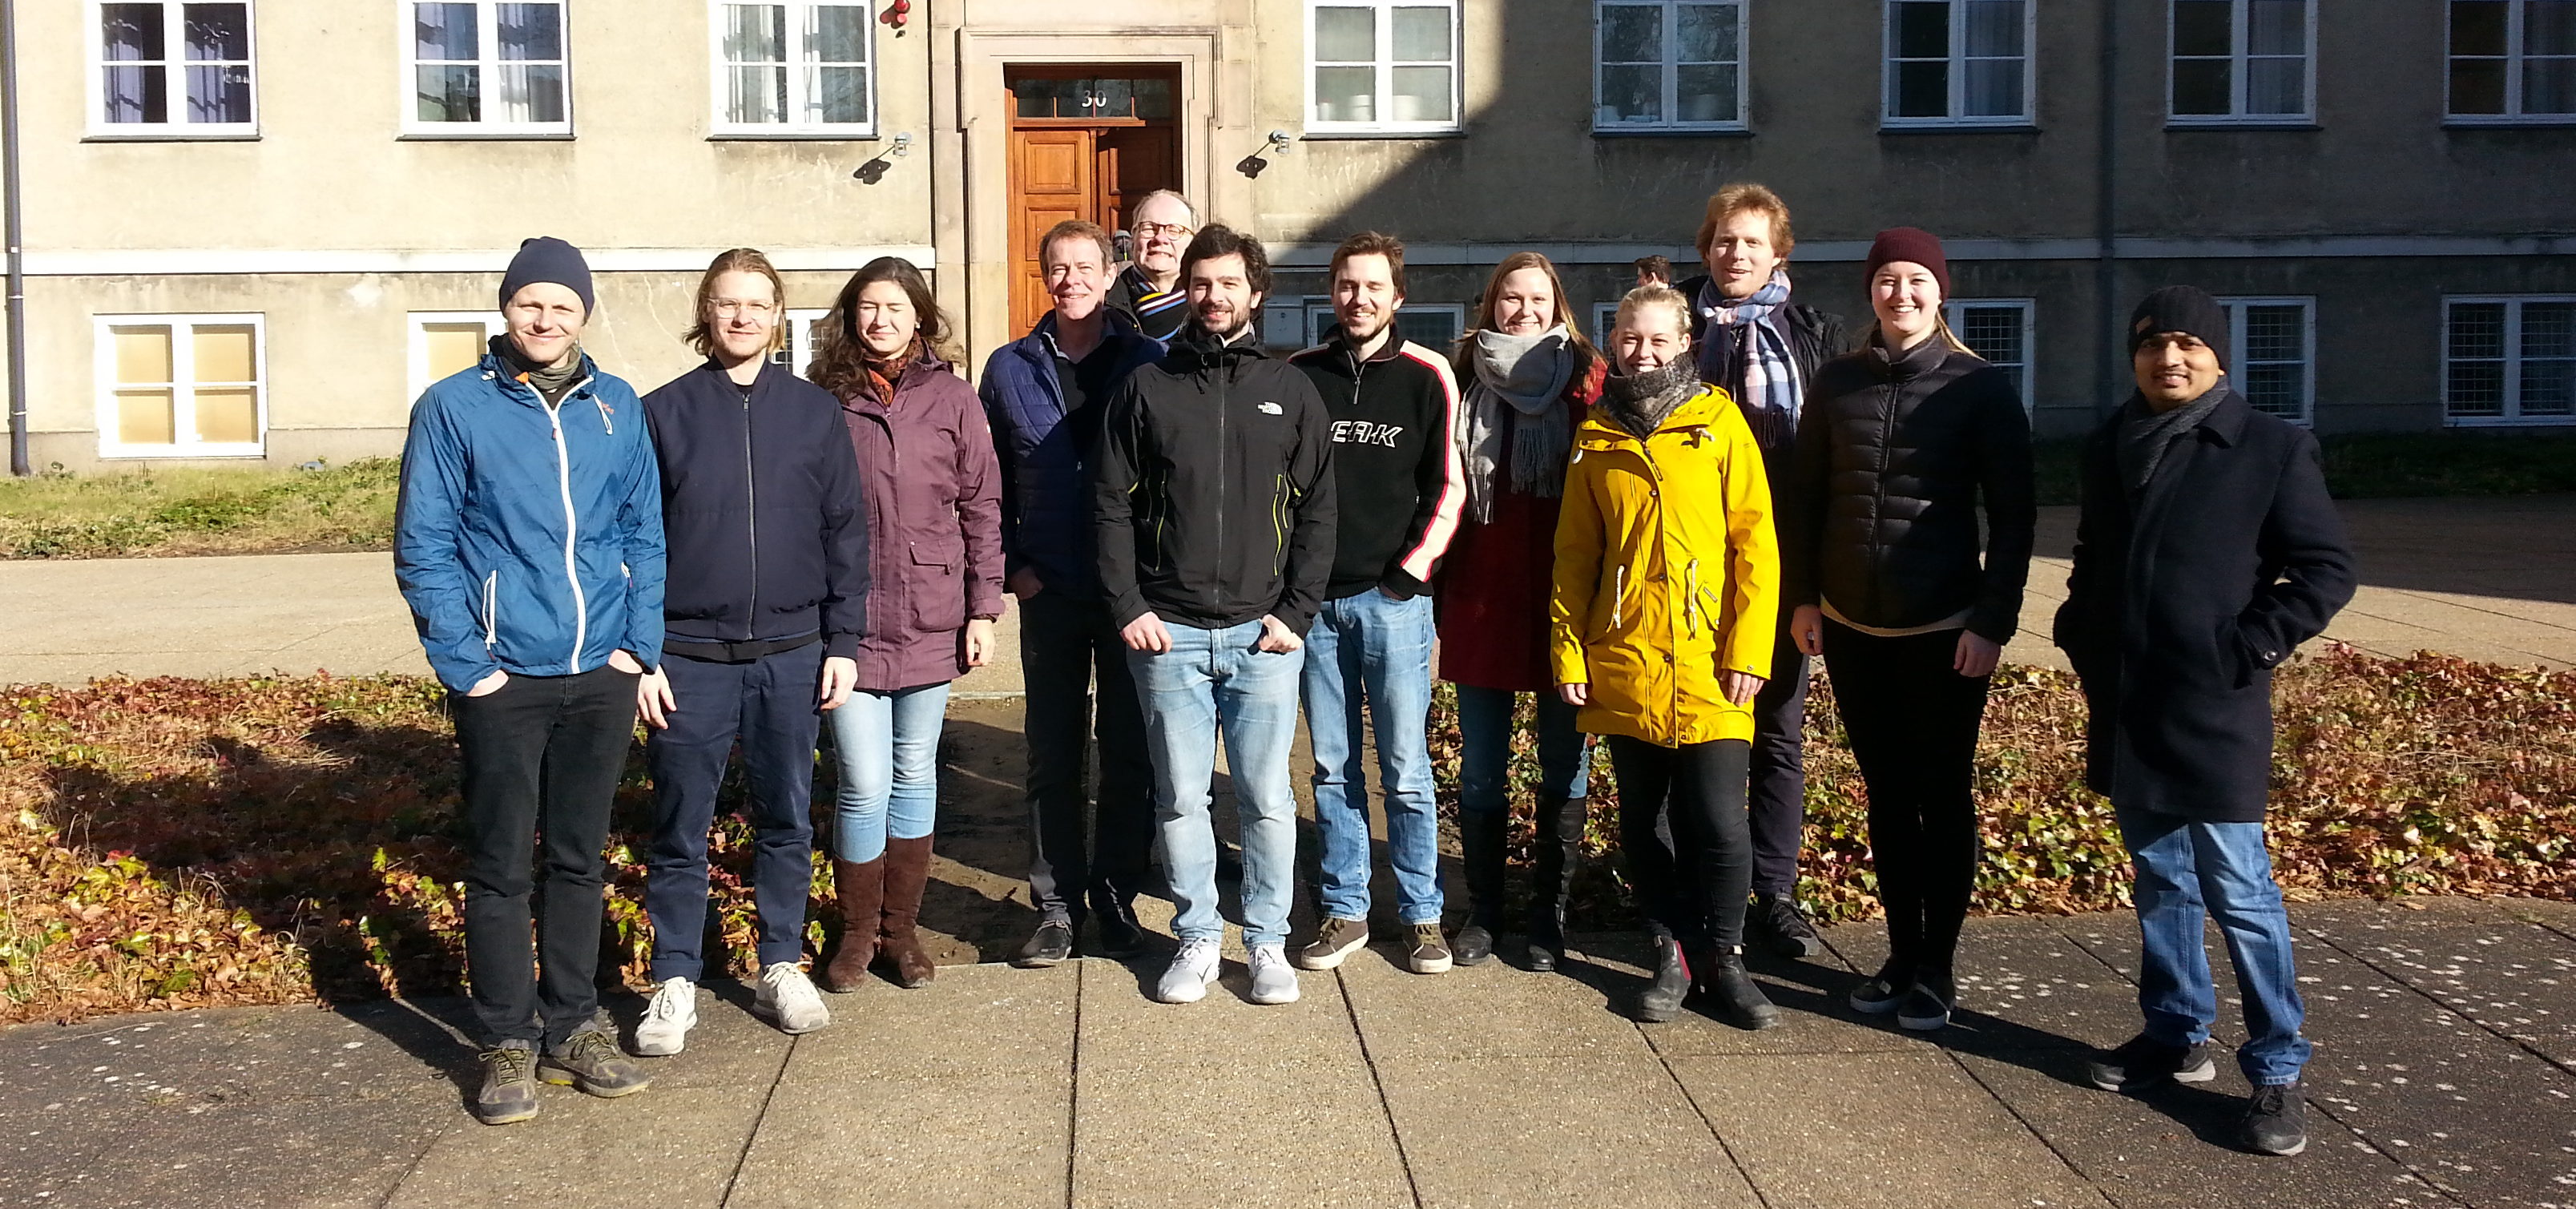
To brighten up cold and weary February in Copenhagen, Ice2ice hosted a climate statistics workshop. Over three days, the three instructors Martin Miles (UniResearch), Francesco Muschitiello (University of Cambridge) and Peter Thejll (Danish Meterological Institute) guided the 12 participants (6 PhD students, 3 masters students, 2 senior researchers and 1 postdoc) through the jungle of statistics.
First things first, you have to be able to crawl before you can walk. Therefore, Martin spend the first day making sure everyone could crawl i.e. getting everyone up to speed with the basic descriptive and inferential statistics (looking at the distribution of the data, computing probabilities and confidence levels). Having mastered the theory, it was now time for the practical part. Francecso steered us through practical hands-on exercises of what we just learned using the statistical program R.
Next day was all about correlation, regression and handling errors. Martin started the day by going through correlation theory and potential pitfalls, as well as the basics of regression analysis. Peter followed with more advanced regression analysis, which assumptions are made, how to handle errors in x or y-direction, or the combination of both etc. After a well deserved (and needed) lunch break, Francesco ended the day by lecturing about Monte Carlo simulations, live-coding examples on how to do it in-practical at the same time.
The last day with planned lectures started off with Martin talking about time- and time-frequency analysis. Francesco was once again in charge of transforming the theory into practical use. After spending 2.5 days on learning time series analysis, the afternoon lecture lead by Martin switched gear and briefly touced upon spatial analysis, spatial autocorrelation and regression and EOF’s.
Too not end this statistics workshop too abruptly, there was no official program on Friday. Instead, Martin hung around, ready to help the participants with questions regarding their own data.
This rounded up a very rewarding, intense and actually fun statistics workshop, worth repeating. For me at least, is was very helpful to see the theory used on time series and data that I actually use in my research and can relate to.
And know I can honestly answer “Yes, that is significant!”.